Here’s my final infographic:
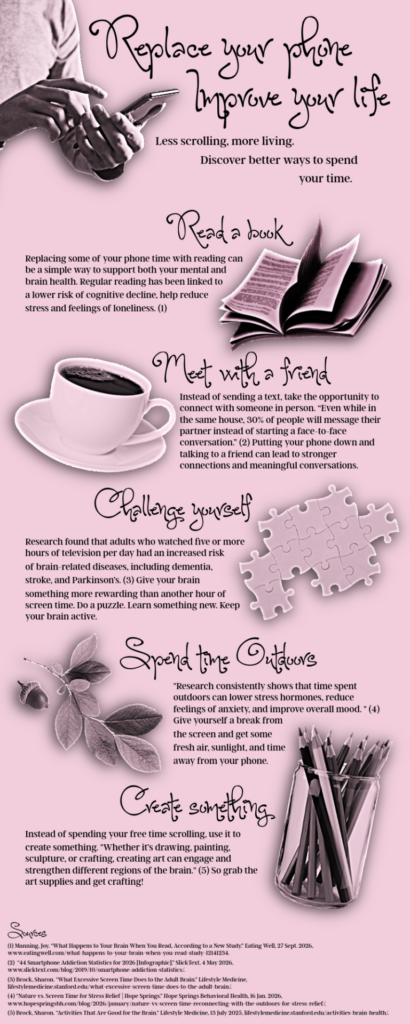
(I inserted the image of the infographic because after several tries at using a link, it wouldn’t work. The quality of the actual graphic is much better but I can’t upload it any better than you see above.)
Changes I made and why:
I feel like I followed through with my initial goals for the infographic, and I am happy with my outcome. I mainly revised the text and layout to make sure there was not too much information while still including enough to clearly communicate the facts and get the points across. I also wanted the visuals to help support the information rather than relying on large chunks of text.
As part of my own testing, I practiced some of the activities I recommended in the infographic. Specifically being creative and spending time with friends. I found these activities more rewarding than spending time on my phone and felt like I wasted less of my day. This also helped me feel more confident that the solutions I included were actually practical and effective.
Sources:
(1) Manning, Joy. “What Happens to Your Brain When You Read, According to a New Study.” Eating Well, 27 Sept. 2026, www.eatingwell.com/what-happens-to-your-brain-when-you-read-study-12141234.
(2) “44 Smartphone Addiction Statistics for 2026 [Infographic].” SlickText, 4 May 2026, www.slicktext.com/blog/2019/10/smartphone-addiction-statistics/.
(3) Brock, Sharon. “What Excessive Screen Time Does to the Adult Brain.” Lifestyle Medicine, lifestylemedicine.stanford.edu/what-excessive-screen-time-does-to-the-adult-brain/.
(4) “Nature vs. Screen Time for Stress Relief | Hope Springs.” Hope Springs Behavioral Health, 16 Jan. 2026, www.hopespringsbh.com/blog/2026/january/nature-vs-screen-time-reconnecting-with-the-outdoors-for-stress-relief/.
(5) Brock, Sharon. “Activities That Are Good for the Brain.” Lifestyle Medicine, 13 July 2025, lifestylemedicine.stanford.edu/activities-brain-health/.
